
In this weeks Google Analytics DIY series, we will be looking at how to set up different views to separate and distinguish the data that will help you to better understand the visitors that are coming to your website. To get started, I recommend that you use 3 different views for basic analytic analyzation: All Website Data, Master View, and Test View.
The All Website Data view displays all data that lands on your website including visitors, spam, bots, and all other junk traffic. This view will remain untouched.
The Master View will be the most accurate view you will use in analyzing your analytics. We will be adding filters to eliminate the ‘junk’ traffic and this view will be a more accurate representation of your traffic. Filters will be discussed in the upcoming tutorial.
The Test View is exactly that, a view that you can use to test different filters, metrics, and segments so you can learn what works best for you with out contaminating the analytics in your Master View.
Let’s get started.
After logging in to your Google Analytics account, click on Admin in the bottom left hand corner taking you to the admin panel.
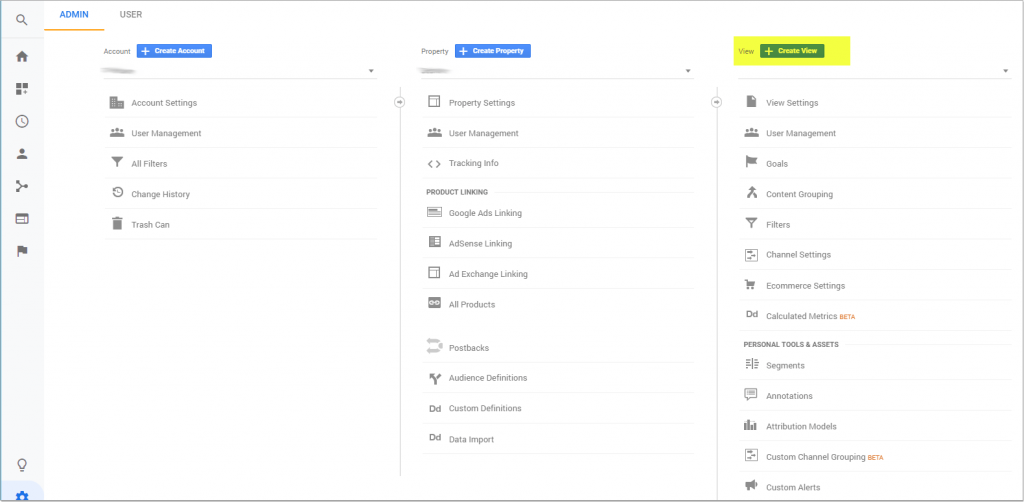
Setting Up Your First View
In the right hand column labeled View, select Create View.
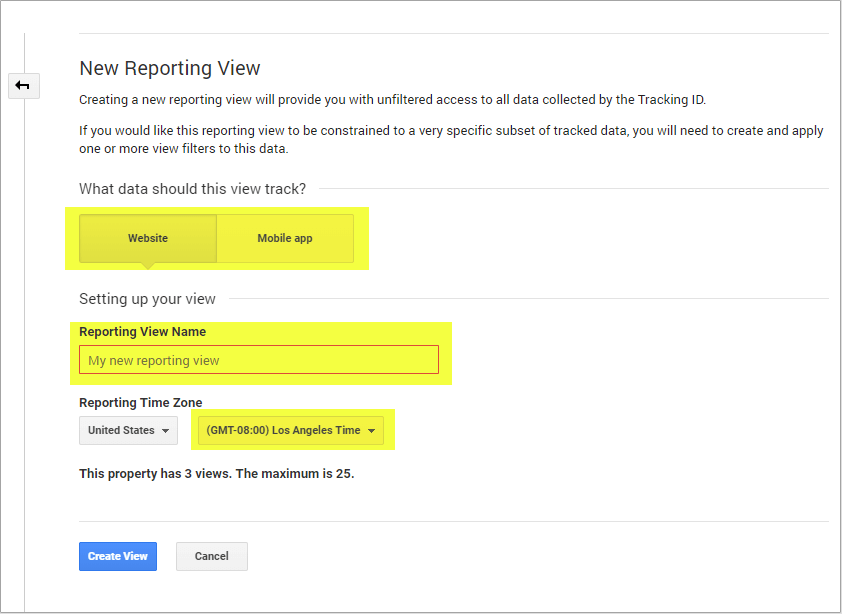
From here, you will need to select Website or Mobile App for the data this view should track. Both types of views can display any data you send to your property, regardless of how you collect those hits. For example, you can see web data in your app views and app data in your web views.
However, if you’re only collecting and sending one type of data to Google, we recommend using views that will give you the best analysis experience. If you only collect data from mobile apps, select app when you create a view and if you only collect data from websites, select web.
Name this View. In following the guidelines of this tutorial, you can name it Master View. However, you can choose whatever name you would like. We just suggest to make it descriptive so you can easily tell what data you are looking at.
From the drop down box select the Reporting Time Zone and choose your country and time zone.
If your Analytics account is linked to a Google Ads account, the time zone is automatically set to your Google Ads preference, and you won’t see this option.
Hit create view, and you are all set up to add filters and start developing your strategy to track your users.
Notes:
- Each Property has a maximum of 25 views
- If your Analytics account is linked to a Google Ads account, data from the Google Ads account is automatically imported into any new view you create in that account.
In our next Google Analytics DIY tutorial, we will be adding filters to screen out spam, bots, and all other junk from your data.
“Make your team feel respected, empowered and genuinely excited about the company’s mission.”
–Tim Westergen, Pandora Founder