
The Google Analytics DIY series continues! We will be providing an overview of the Behavior Report in its default settings in your GA dashboard.
The Behavior Report Overview
- Pageviews – Total number of pages viewed. Repeat views of a single page are counted.
- Unique Pageviews – The number of sessions during which the specific page was viewed at least once. A unique Pageview is counted for each page URL + Page Title combination.
- Average Time On Page – The average amount of time users spend viewing a specific page or screen, or set of pages or screens.
- Bounce Rate – The percentage of single-page session in which there was no interaction with the page. A bounce session has a duration of 0 seconds.
- % Exit – The number of exits/ pageviews for the page or set of pages. It indicates how often users exit from that page or set of pages when they view the page(s).
Let’s get started.
Behavior Report
To access the Behavior Report select Behavior on the left side of the screen, then select Overview.
Navigate to the right side of the screen to select a time period you want to view. This provides you with the option to input the Date Range in variables of Custom, Today, Yesterday, Last Week, Last Month, Last 7 Days, or Last 30 Days. You can set up comparisons for different time periods. You can view the difference of site traffic for August of last year with August of the current year. After selecting your time period, select apply.
Please note, tracking data will only track back to the date you placed the analytics code on your website; there is no information prior to the set up of your GA account.
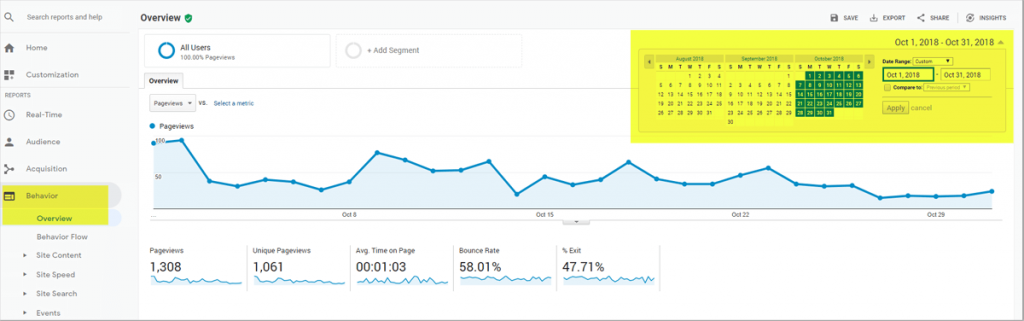
The first chart in view is the Info-Graph chart. In the drop-down box in the upper left hand corner, you can select Pageviews, Unique Pageviews, Avg Time on Page, Bounce Rate, or % Exit.
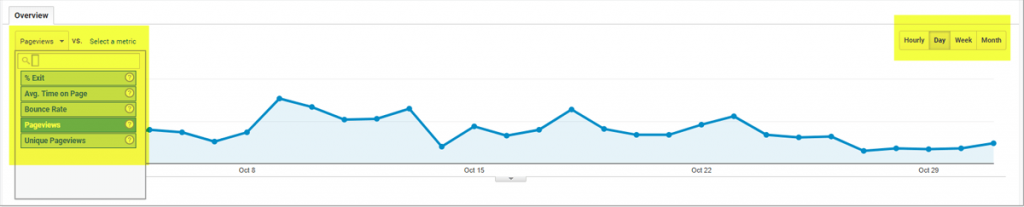
At the right side of the graph you can easily select the detailed time view to analyze by Hour, Day, Week, or Month. This chart provides a visual overview of peak days and times that users are viewing your website. This information proves invaluable in getting to know your users, and the best practices to market to them.
The second half of the Behavior Report Overview page provides a detailed description of each metric with Site Content divided into four categories: Page, Page Title, Search Term, and Event Category. In the chart shown, the Site Content is Page, with the Page column displaying the URL of the top 10 Pageviews for the time period chosen. To see a full report of all the website pages viewed in this time period, click View Full Report in the lower right hand corner.
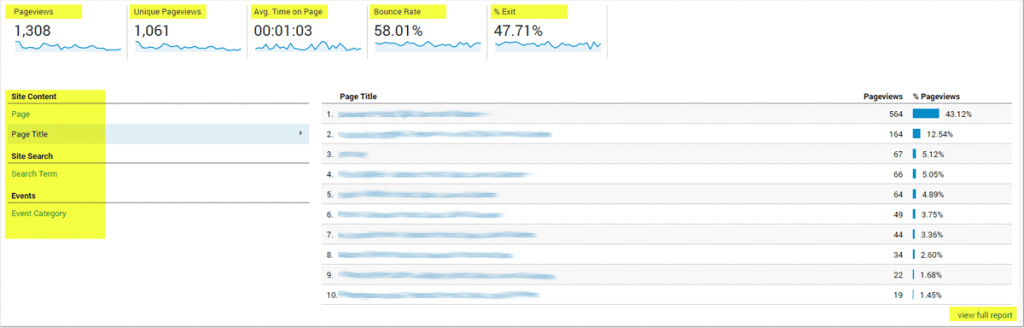
Using the same chart, but changing the metric to Page Title, the Page viewed information is now listed by Page Title. This is often easier to understand than reading the URL.
Term and Event Category tracking are custom metrics which need to be created before you will receive any data on them. This will be covered this in an upcoming BST tutorial. Visit GoogleAnalytics – Site Search Term or
In upcoming tutorials, we will be expanding the explanation of the Behavior category reports by illustrating Behavior Flows (one of my favorite reports), Site Content, Speed, and Search, as well as Events which reveal the actions taken by users on your website.
“If what you are doing is not moving you towards your goals, then it’s moving you away from your goals.”
– Brian Tracy, CEO Brian Tracy International
RECENT POSTS
- Google Analytics DIY – How’s the view up there?

- Google Analytics DIY: The Behavior Report- What’s Inside?

- Google Analytics DIY: Understanding the Acquisition Report

- Google Analytics DIY: Reports! Reports! Reports! What are they telling me?