In this Google Analytics DIY tutorial, we are interpreting the Acquisition Report. This highlights how your site acquired visitors. You can see the top channels driving visitors to your website (i.e. Google, Bing, Facebook, email, and others), track Google Ads and Social Media advertising campaigns, as well as see the number of visitors who visit each (landing) page on your website.
Similar to the previous analysis of the Audience Report, we will explain the default settings of the Acquisition Overview. There are far too many variables on the report to discuss in one post. Our goal is to provide you with a basic understanding, providing you with necessary information to decipher the stats provided.
Let’s get started.
Acquisition Report
Login to your Google Analytics account and navigate to Views. In this tutorial we will be focusing on the basic All Website Data to walk you through the platform. We will later discuss creating your own custom view.
If you need help setting up your Google Analytics account see our Getting Started post that details the setup.
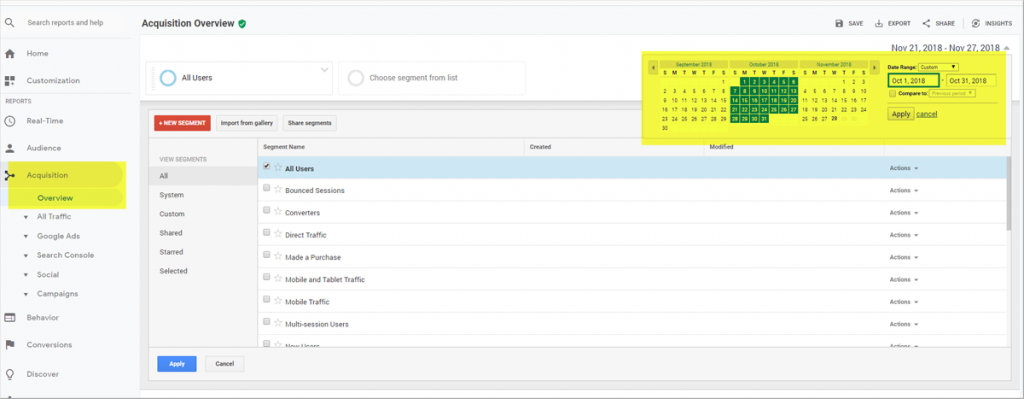
To view the Acquisition Report select Acquisition on the left side of the screen, then select Overview.
Navigate to the right side of the screen to select a time period you want to view. This provides you with the option to input the Date Range in variables of Custom, Today, Yesterday, Last Week, Last Month, Last 7 Days, or Last 30 Days. You can set up comparisons for different time periods. You can view the difference of site traffic for August of last year with August of the current year. After selecting your time period, select apply.
Please note, tracking data will only track back to the date you placed the analytics code on your website; there is no information prior to the set up of your GA account.
Top Channels
The Top Channels overview is the first overview after applying the date range for your analysis. A pie chart visual represents the source(s) directing visitors to your website, while the Users graph displays the number of visitors on your site in the selected date range.
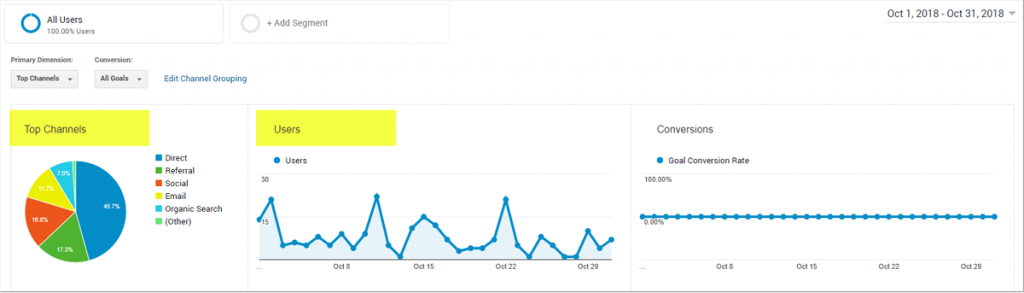
Below these charts are the acquisition sources and the data associated with each. Each is defined below:
Organic Search: Visitors who found your website though a search engine, such as Google, Bing, Yahoo, etc.
Paid Search: Visitors who by clicked an ad you are promoting on one of the search engines.
Direct: Visitors who directly entered your domain name into their address bar, therefore coming directly to your website with no alternate source.
Referral: Visitor who clicked on a link from another website which led to your site. For example, a vendor or a professional organization may have your site listed.
Social: Visitor who came to your site via social media such as Facebook, Instagram, LinkedIn, etc.
In order to view Conversion statistics, you will need to set up Goals within the analytics platform. We will cover this in another tutorial.
Top Channel Details
The bottom portion of the Acquisition Overview Report provides more detail about your site visitors by carving each into separate categories including Acquisition, Behavior and Conversions.
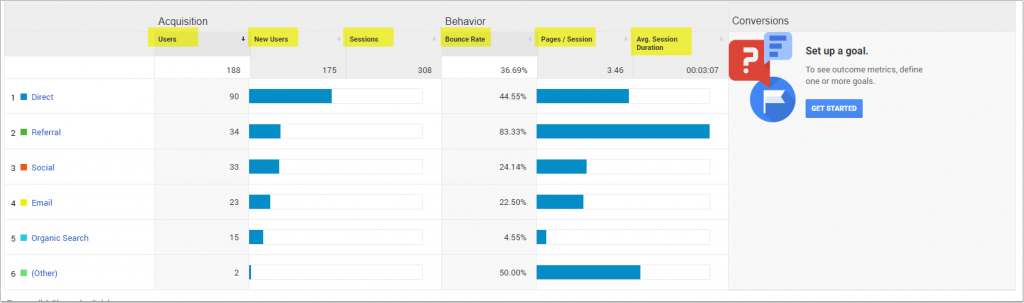
Acquisitions includes total users, new users and number sessions withing the date/time range you selected.
Behavior statistics show the sites Bounce Rate, Pages Per Session, and Avg Session Duration.
Conversion data will not appear until specific Goals have been defined in the GA platform.
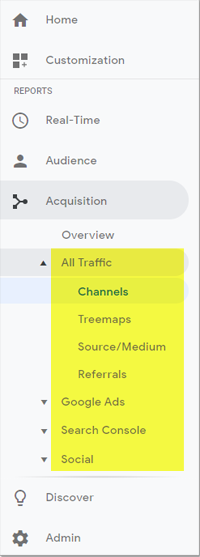
To explore further detail in the Acquisition report go the the left panel and choose the options below. These provide a more indepth understanding of your site users.
All Traffic: Channels, Treemaps, Source/ Medium, Referral
Google Ads: Campaigns, Treemaps, Keywords, Search Queries, Hours Of Day, and Final URL
Search Console: Landing Pages, Countries, Devices, Queries
Social: Overview, Network Referrals, Landing Pages, Conversions, Plugins, Users Flow
Campaigns: All Campaigns, Paid Keywords, Organic Keywords, Cost Analysis
Google Analytics should be a part of your daily practice. The best way to understand GA and all the reports is to constantly monitor and read them. Not only will this help you become more skilled in the platform, it will also provide valuable insight into your site and its users.
Like all things in life, the more practice, the better you will get.
“Failure is simply the opportunity to begin again, this time more intelligently… A business absolutely devoted to service will have only one worry about profits. They will be embarrassingly large.”
-Henry Ford, founder Ford Motor Company