Over the next few weeks in our Google Analytics DIY series posts, we will be discussing Reports, beginning with the Audience Report. There are far too many variations of reports in GA to cover all the possibilities, so we will be looking at the basics of each report. Any change to the report, even simply changing a Dimension & Metric or adding a Segment you will alter or increase the information that you receive. Therefore, we are going to focus on the reports as they appear in default with no changes or additions.
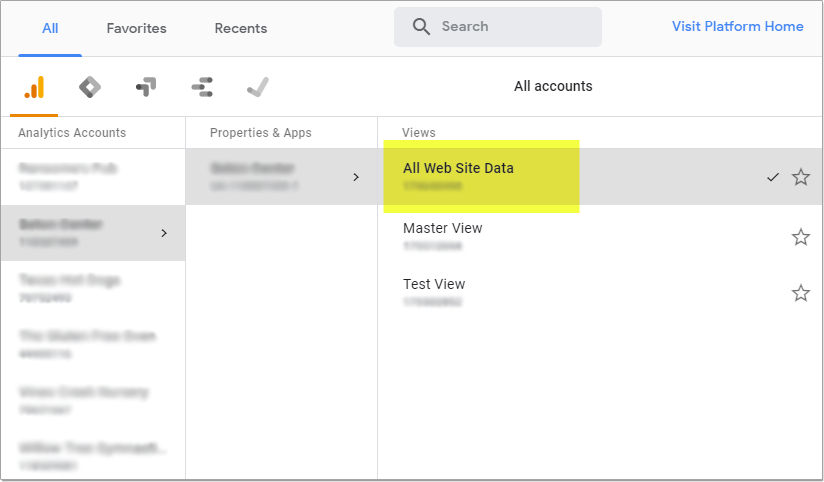
Login to your Google Analytics account and navigate to Views. In this tutorial we will be focusing on the basic All Website Data to walk you through the platform. We will later discuss creating your own custom view.
Audience Report
To view the Audience Report select Audience on the left side of the screen, then select Overview.
Let’s start at the top and work our way down.
Here you can select the time frame you want to look at.
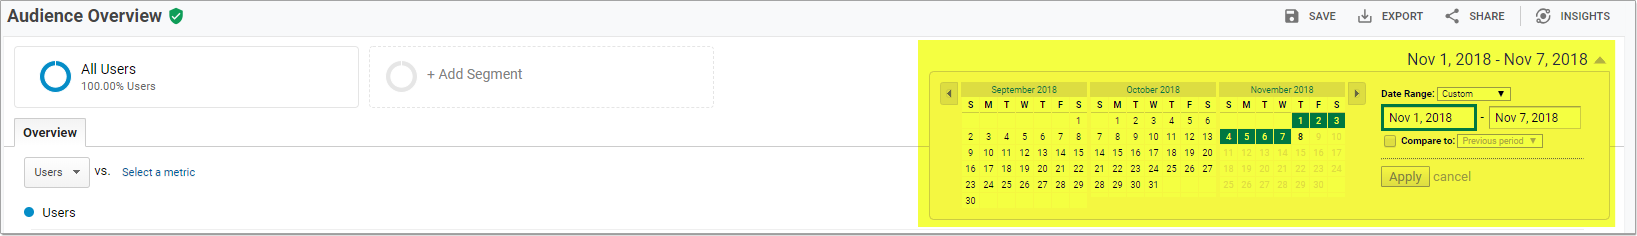
On the right side of the screen you see a drop down box to input a time period you want to track. Selecting this gives you the option to input the Date Range in terms of Custom, Today, Yesterday, Last Week, Last Month, Last 7 Days, or Last 30 Days. You can set up comparisons for different time periods. For instance, you can view your sites traffic difference for August of last year with August of this year. After setting your time period, select apply.
Please note, tracking information can only go back to the time you placed the code on your website; there is no information available before you set up your GA account.
Overview Chart
The Overview chart is based on the time frame you selected. The chart will show how many visitors came to your site and when these Users visited.
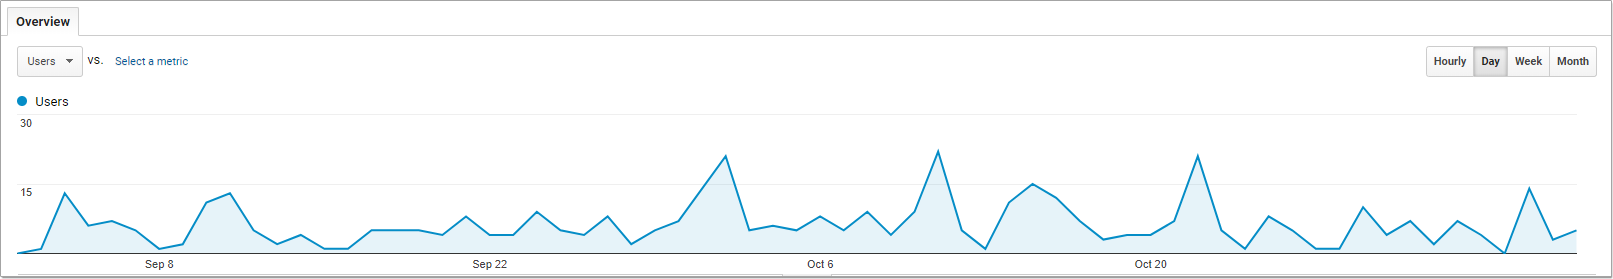
This can be broken down into Hourly, Day, Week, or Month. If you scroll your mouse over the timeline it will show how many Users came at each reference point.
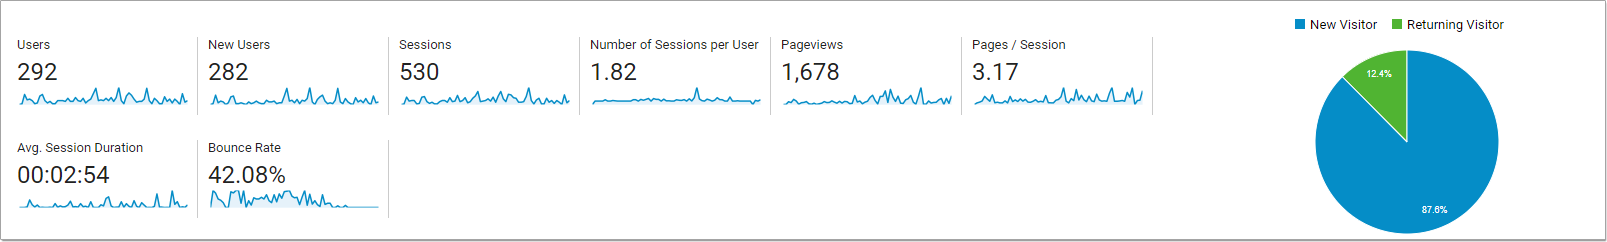
Users – Users is the total number of visitors to your website for the time period chosen.
New User – New User is the total number of 1st time visitors to your website in the time period chosen.
Session – The period of time a user is active on your website. By default, if a user is inactive for 30 minutes or more, any future activity is attributed to a new session. Users that leave your site and return within 30 minutes are counted as part of the original session.
Number Of Sessions Per User – The average number of sessions each User has in the chosen time period.
Page Views –Number of totals pages on your website that were viewed by all the Users that visited during your chosen time period.
Pages/Session – Average number of pages that visitors to your website looked at per session.
Avg Session Duration – This tells you how long on average, visitors are staying on your website. Using the graphic above, we see that on average, every visitor that comes to this website, looks at 4-5 of the pages, with an average time of being on the website of almost 3 minutes.
Bounce Rate – Bounce Rate is the percentage of visitors to your website that view one page and then leave your website. For example, if 100 people visited your website in the chosen time period, and 45 of those visitors only looked at one page, then left your website, your Bounce Rate would be 45%. Keep in mind there is no definitive number that qualifies as a good or bad Bounce Rate. For instance, if a visitor lands on your Home page, you want them to continue deeper into your website, so a high Bounce Rate for that page would be bad. However, if a visitor lands on a Contact or Form page, you want them to provide the necessary information at the end of their journey and move on, so a high Bounce Rate on these pages would be considered good.
On the right there is a Pie Chart showing the difference between New and Returning visitors in percentages.
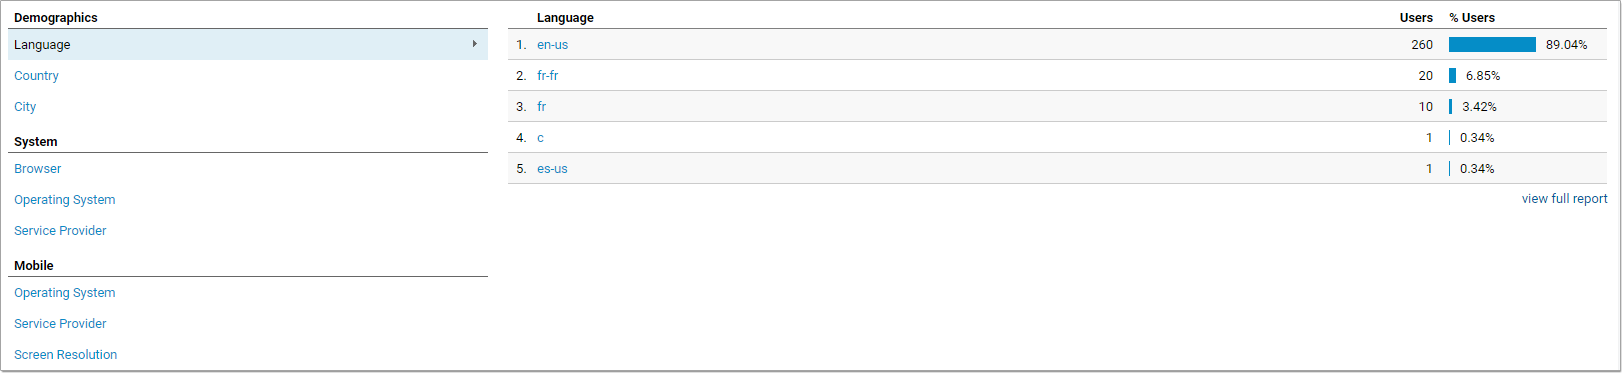
Demographics
- Language
- Country
- City
System
- What Browser visitors are using (Chrome, Firefox, Edge, etc)
- What operating system visitors are using (Windows, Mac, Android, etc)
- Service Provider ( Verizon, Comcast, etc)
Mobile
- Operating System (Android, iOS, Blackberry, etc)
- Service Provider ( Verizon, AT&T, T-Mobile, etc)
- Screen Resolution
Hopefully we have provided you with a basic understanding of the Audience Report. We are always here to help if you have questions, contact us directly and we’d be happy to offer more insight.
Tune in next week as we will be breaking down the Acquisition Report.
“The critical ingredient is getting off your butt and doing something. It’s as simple as that. A lot of people have ideas, but there are few who decide to do something about them now. Not tomorrow. Not next week. But today. The true entrepreneur is a doer, not a dreamer.”
Nolan Bushnell, founder Atari andChuck-E-Cheese